Even seasoned storage people sometimes get focused on the wrong metric when analyzing self-storage. If you’re new to self-storage, it can be hard to understand all the financial metric slang and acronyms and what one should really be focused on.
Which one matters most?
I’ll answer that from my perspective towards the end of this episode, but let’s look at some simple, but real definitions of the main financial benchmark terms you can hear bantered around in this self-storage space, and what they are really measuring. And we will leave you with an Excel Worksheet you can download.
CAP Rates
CAP rates are perhaps the most bantered around metric by real estate “professionals” marketing self-storage and is the most misrepresented number ever.
It is atrocious.
A hot tip…whatever you see in a marketing package as the “CAP Rate,” just know it is not that.
In the rest of the commercial real estate and appraisal world, the CAP Rate is used to determine the value of a commercial real estate asset, not to validate some bogus price a Seller wants or an agent wants to get.
CAP Rate means capitalization rate.
Let’s start with how an appraiser uses CAP Rates to determine the value of a commercial real estate asset.
First, determine the NOI (net operating income).
From a 30,000-foot view, self-storage (and all income-producing commercial real estate) is a hard asset (the buildings) generating operational income (usually rent). But all the rent that is put into the bank is not yours, usually.
There are operational expenses to run the business that generate the operational income. You have electricity and water. You pay property taxes. You have advertising. You will need people, most likely, even in a “managerless” operation. You need a website, etc.
To calculate net operating income, one takes operational income and subtracts operational expenses.
Now, keep in mind there could be other types of income and other kinds of expenses. These are not calculated in the NOI.
Examples of other types of income are refinance loan proceeds…sale of extra land, etc. These would be loan income and capital income, not operational income.
There are also other types of expenses. If the hard asset generating the operational income needs a new roof, that is a capital expense and not included in the NOI calculation. Commissions paid to the agents creating fictitious CAP rates in their marketing packages are not considered operational income. Loan payments are not considered in the NOI calculation. A facility could be purchased all cash or with 100% debt. The NOI stays the same.
NOI is the operational net operational income that the asset produces.
Operational income less operational expenses equals net operating income.
Income – Operating Expenses = NOI
So what an appraiser does is take the last calendar year profit and loss statement (P & L) and/or the last 12 months (“trailing 12” P & L) and calculates the NOI. That is what a real NOI is.
Why is the NOI so important?
Because that is what you are really purchasing, the income stream, yes, you are buying buildings, leases, goodwill, etc. But all that stuff is so you can have that net income stream. You are buying the NOI.
So what is a CAP Rate?
For an appraiser, the CAP market rate of return a ready, willing, and able buyer will expect for a specific asset (like self-storage) with that income stream.
Appraisers track those CAP Rates. For example, today, an appraiser might say that for a stabilized “institutional grade self-storage” in major markets, CAP rates would be 6.5%. In secondary markets, closer to 7%.
So if the NOI was $350,000, at a 6.5% CAP, that facility would be worth $5,384,615 (350,000 divided by .065).
At a 7% CAP rate, it would be worth $5,000,000 (350,000 divided by .07).
If you are a Buyer, and you want to know what to pay using CAP Rates, the first thing is for you to calculate what you think YOUR NOI will be. Under no circumstances use the CAP Rates in listing Offering Memorandums.
Your estimated first 12 months of ownership NOI will be a function of what you think the income will be (usually, I just use what the current income is or is close to it) and how I will run the project.
I often change the advertising expense, add or take away employees, adjust for an increase in property taxes, then make a best guess operating expense number I will most likely have. I subtract that from the income, and that is my projected NOI.
Never, never take the expense projections cross the board from the OM. Do your own. The projections in the OM are 99.35% guaranteed to be wrong. Yes, you may use their tax number or utility number, but put in all your numbers based on how you think you will run the property.
If you again calculated YOUR NOI to be $350,000 and you wanted to buy on a 7% CAP, $5 million is your number.
Pro Tip: As smaller investors and players in the storage space, it is rare that we can buy a stabilized facility using CAP Rate calculations and get the returns we need. I must always buy on anticipated returns after I add value. So I rarely use CAP rates to decide what I can pay for an existing facility. I use the other metrics mentioned below to help us determine what I can pay for an existing self-storage project. But I do use CAP rates in my Proformas to determine future values. If in year 5 my NOI is projected to be $500,000 and it is in a secondary market, I might use a 7% CAP. That would put a value in year 5 of $7,142,857. It lets me know how much value my value-add play has created.
ROI
ROI stands for Return On Investment.
This is also sometimes called Cash-on-Cash Return.
This is a metric I use as a benchmark all the time. It is also very important if you are raising money, because investors want to know year by year what they can expect as a cash return on their investment, so they can make decisions about where best to invest their money.
ROI is a year-by-year calculation. Each year, the project should have a different, mostly increasing ROI.
So how is it calculated?
It is the yearly net cash flow divided by the down payment (or cash in the deal).
Storage World Analyzer, for example, calculates the ROI each year based on the down payment. Let’s look at a ten-year cash flow statement on a project.
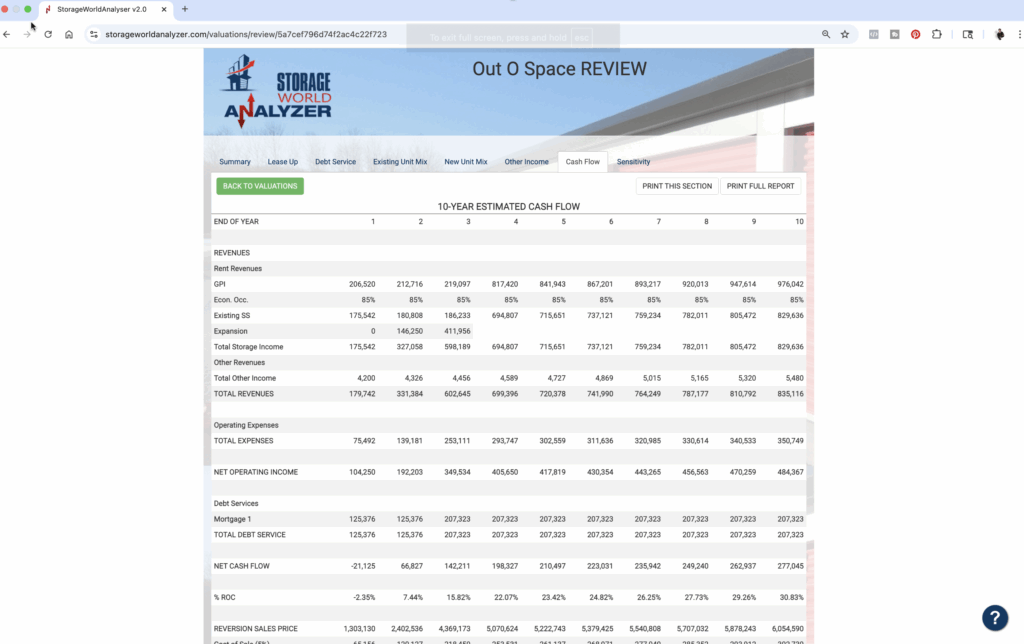
You can see this was an expansion. In the first couple of years, the ROI return was low while we built the expansion and then leased it up. But after the expansion was stabilized, we expected to generate 15% to 23% ROI in the next three years or so.
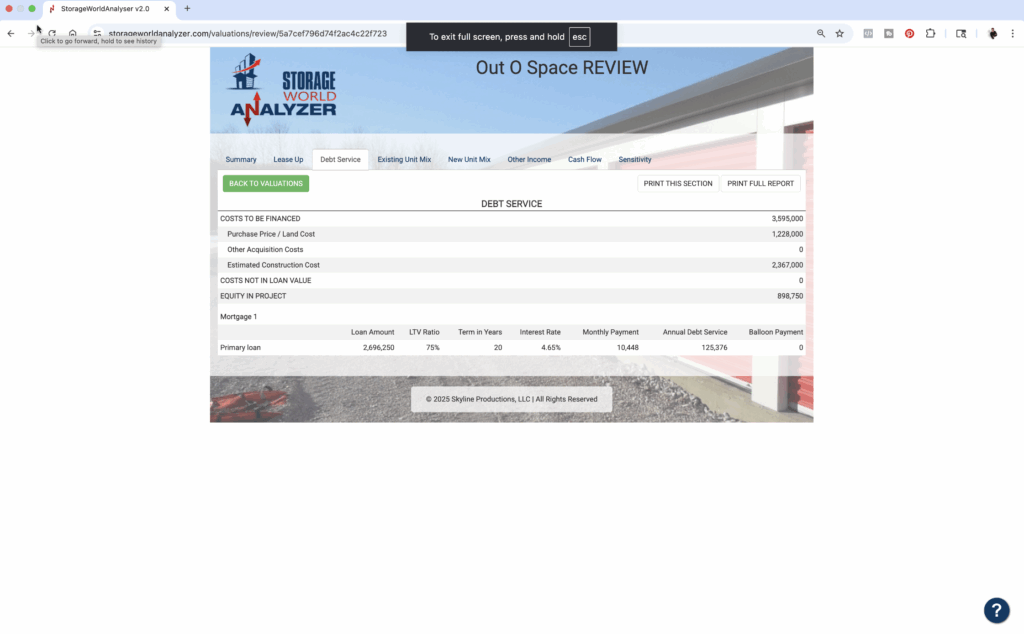
You can see in this deal structure, $898,750 was the cash going into this deal.
So what the ROI is telling us in year four, for example, is that the $898,750 down payment is projected to generate a 22.07% ROI with a net cash flow of $198,327.
You can see at the bottom of the page that I was projecting a value of $5,070,624 for year 4.
So what CAP Rate did I use to project future values?
You can look at the previous section to see the formula, or you can just plug in the numbers from this ten-year projection into the Excel sheet download you can get at the end of this episode.
You have the projected NOI in year 4 of $405,650 and the value of $5,070,624.
You can divide the NOI by the price, and see that at the time I did this analysis, I used an 8% “Reversion CAP Rate” (CAP Rate to determine future sales values).
For me, the ROI is a critical calculation. I want to know if I invest, or put investors’ money in a deal, what kind of return I can expect on that initial investment.
Often with the Offering Memorandums I see today, when I plug in real numbers, in other words, real operating expenses I expect to have, I see returns in the negative numbers or 2% to 6% ROIs.
I can put money in an index mutual fund and do better than that, so why would I go into debt and burn calories to do that deal?
So for me, this is a more relevant metric I use to see what I need to pay and if I want to do the deal.
I also look at the Internal Rate of Return. I will combine these two metrics to determine if I want to do the deal.
Let’s look at the IRR.
IRR
I have discovered a lot of people are not quite sure what the IRR really is. It’s not that hard to understand, but the formula is complicated. There is a page on the downloadable Excel attachment you can use to calculate an IRR.
So what IRR stands for is Internal Rate of Return.
It is a financial metric that allows you to compare any two or more investments and see which investment generates the best projected return over the life of the investment.
The Storage World Analyzer automatically calculates this number, and it is on the first page of reports called “Summary.”
But let’s dive into it so you really understand it. Let’s use the example above in the ROI.
To calculate the IRR, you need two columns: one for time periods and the other for cash flows.
Also, since this is a measure of the life of the investment, in the last cash flow, there needs to be a “disposition” number (fancy jargon for sales proceeds).
Usually, I set up the chart like this if I am calculating in Excel or on a financial calculator.
| 10 YEAR IRR CACULATION: | |||
| TIME PERIOD | CASH FLOW | IRR | |
| 0 | |||
| 1 | |||
| 2 | |||
| 3 | |||
| 4 | |||
| 5 | |||
| 6 | |||
| 7 | |||
| 8 | |||
| 9 | |||
| 10 | |||
So what is time period 0? Or better yet, when is time period 0?
It is the start of the deal, usually at closing. What goes in here is the amount of cash or investment in the deal. In this case, we are outing in $898,750. That was the down payment.
In Excel and financial calculators, it always appears as a negative number, cash going into the deal.
Next, we put in the net cash flows for each time period. I get those straight off the ten-year cash flow page if I am calculating a ten-year IRR. We can also calculate a five-year IRR.
So in this case, it would be Year 1 a -21,125. Year 2 would be $66,827. I enter these in the time periods from 1 through 9, then stop.
So our table would look like this:
| 10 YEAR IRR CACULATION: | |||
| TIME PERIOD | CASH FLOW | IRR | |
| 0 | -$898,750 | ||
| 1 | -$21,125 | ||
| 2 | $66,827 | ||
| 3 | $142,211 | ||
| 4 | $198,327 | ||
| 5 | $210,497 | ||
| 6 | $223,031 | ||
| 7 | $235,942 | ||
| 8 | $249,240 | ||
| 9 | $262,937 | ||
| 10 | |||
Now, whatever is the last year of the IRR calculation, there are two numbers added together. One is the net cash flow for that year, and the other is the net sales proceeds. If you look at year ten of the ten-year cash flow page, you will see the net cash flow is $277,045, and the net sales proceeds are projected to be in year ten $3,847,926 (it may be cut off from the screenshot). Remember, this is a pre-tax number. Add those two numbers together and you get the cash in year 10.
| 10 YEAR IRR CACULATION: | |||
| TIME PERIOD | CASH FLOW | IRR | |
| 0 | -$898,750 | ||
| 1 | -$21,125 | ||
| 2 | $66,827 | ||
| 3 | $142,211 | ||
| 4 | $198,327 | ||
| 5 | $210,497 | ||
| 6 | $223,031 | ||
| 7 | $235,942 | ||
| 8 | $249,240 | ||
| 9 | $262,937 | ||
| 10 | $4,124,971 | 24.6% | |
As you can see, the IRR for this financial model is 24.6% in a ten-year financial model. What this is saying is that the $898,750 going into the deal at the start of the investment is projected to earn an average of 24.6% per year over the life of this deal.
Would you do that deal? I most likely would. 20% ROI when stabilized and going up each year, and a 24% to 25% IRR.
This is the metric that I really track closely when doing deals. You need to come up with your own benchmark numbers, but today, in this current environment, I look for 12% plus ROI after value-add play and at least 20% projected IRR in a ten-year period. But don’t use my financial benchmarks for yourself. Come up with your own. You may want 20% ROI and 25% IRR.
Let’s look at a five-year IRR. All the numbers are the same years 0-4, then we just add to the cash flow in year 5, the net sales proceeds for that year. Then wa-la…the downloadable Excel sheet tells you what the IRR is.
| 5 YEAR IRR CACULATION: | |||
| TIME PERIOD | CASH FLOW | IRR | |
| 0 | -$898,750 | ||
| 1 | -$21,125 | ||
| 2 | $66,827 | ||
| 3 | $142,211 | ||
| 4 | $198,327 | ||
| 5 | $2,739,121 | 29.9% | |
So from a return perspective, which is a better time to sell, in five years or in 10 years?
Now you may want to just keep the asset for the past ten years, and that is fine. But I find it interesting that in some deals the IRR returns are higher in ten years, others take five.
If you have investors in a deal, don’t you think this would be good information?
Conclusion
So we are back to the question, which metric matters most in self-storage?
I hope you are beginning to see that it depends on your goals, what type of deal you are doing, and how your deal is structured. For me, going into IRR hasn’t been something I have been too focused on in the last fifteen years in self-storage. If I am buying a NNN leased deal (where the tenant pays all operating expenses and the income is my NOI), like a Walgreens or something, the going in IRR is everything.
As a smaller player in the self-storage space, the ROI and IRR are metrics I am very focused on.
You can go to here and download the Excel template for each of the financial metrics discussed in this episode.
Good luck in your self-storage adventures.