Often, we deal directly with a seller when buying self-storage.
Often, with listed property, we see a shiny OM (offering memorandum), and everything looks great. Then we see the other due diligence documents, and the facility can lose some of its luster.
I have often stated that I could look at a random daily “Management Report” and pretty much tell you what a facility is worth.
Let me show you how I look at them. Not that this is the definitive way. The purpose of this episode is to show how much information about a project one can get from these reports.
For today’s episode, I am going to use a random Site Link Daily Management Summary Report.
I often get “Site Link Occupancy Statistic Reports,” and they are very helpful, but I can actually glen more information off a Management Summary Report on how the current owner runs the facility.
Both are awesome.
If you can’t get any other information about a facility, if you get this report or the reports from whatever operating system they are using that covers the same information, you can determine a lot.
Let’s look at a random Management Summary Report I found on my computer from a facility that I looked at. I have redacted any information that would tell you where and when.
Order In Which I Look
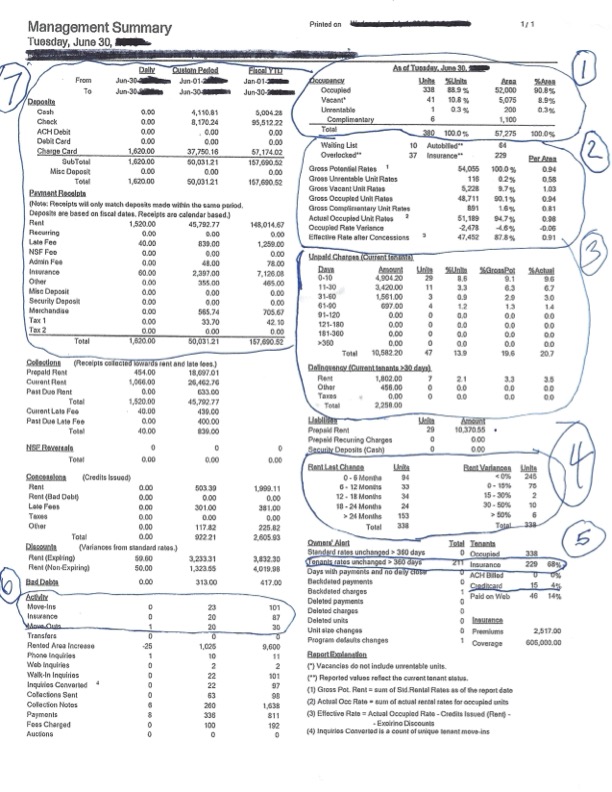
- Occupancy: I see I am looking at a 57,275 square foot facility.
Occupancy Summary Report or a Unit Mix Report will tell me how much is climate- controlled and how much isn’t. But for now, I see the size.
I don’t pay much attention to units but focus, at least for now, on square feet for obvious reasons. A 5 x 5 and a 15 x 30 are both 1 unit each, but very different sizes. Square Feet give me a much more accurate picture of what is going on.
On the surface, this project looks well occupied.90.8% of the square feet are occupied, and they only have one unrentable unit (it could be anything…door problem or even used as storage for the owner).
They have less than 1% complementary. We usually will allow up to 2% or 3% of the units to be given to non-profits free of rent who service the area the facility is in. That was just our practice.
- Rates: It appears that the project is probably all non-climate controlled, or almost all because the Gross Potential Rent (GPI) is .94 cents per month.
The GPI is $54,055 per month.
The GPI of occupied units is $48,711.
However, after concessions, they are scheduled to bring in $47,502, or 87.8%, or .91 cents per month per occupied unit. This is the scheduled economic occupancy.
Not bad.
A well-run facility is between 3% and 5% difference between physical and economic occupancies. This facility, at least for now, looks like it could be around 3%.
- Delinquency:Next, I go to delinquency. I can tell this owner most likely uses the anniversary date for when rent is due rather than the first of the month. I wonder why. Perhaps it is a lower-income area. I make a note to check the demographics closely.
I see immediately that the majority of what is due but not paid is in the first 30 days. Good, I guess.
If not anniversary date, there must be a lot of auctions because he has only 7 units past 30 days. I wonder why they are allowed to still be there.
First red flag is we are at the end of the month and the Delinquency Ratio is 19.58%.
In a well-run facility it is 5% or less.
The “Delinquency Ratio” this is a made up ratio we use as a Key Performance Indicator (KPI). We use it as a management benchmark so our Managers know when it is time for auctions, more energy in collections’, or we are just going to have a performance review talk.
How we calculate the ratio is all, delinquencies divided by monthly GPI.
In this case the math is 10,582 divided by 54.055. That is 19.58%.
I make note to check to see if low income area. I also want to determinate if they have payment plans with past due customers (a big no-no), or if this is just an anomaly.
In a stabilized facility that is well run, it is not this high.
- Rate Change. The have had a few units with rental increases in last year, but it looks like it has been about 2 years since they have had a major price increase.
Again, this makes me want to check the average household income.
- Tenant Insurance. It looks like 68% of tenants are paying for tenant insurance.
There is some room for an upside.
I make a note to see when they started.
I also see they only have 4% prepaying with credit cards. Very low.
It makes me really begin to think it is a lower-income area.
- Activity: Looks like in the middle of the year (*this is a report for June 30), they have had 101 move-ins and 30 move outs. I wonder if they should have not had more move-outs. Usually in a stabilized facility, these numbers are closer to each other.
- Value: Now I quickly estimate the value.
This is not what I will offer, and I have a lot more validation to do. But I am guessing I am close to what I would actually offer if I did so.
Plus, going through this drill, I will learn more about the facility and how it is run.
It looks like they have actually collected $148,0125 in six months. That’s only $24,669 worth of scheduled rent coming in.
Remember, the scheduled rent coming in should be close to $47,452.
As I look at the late fees, they seem low, less than 1% (usually closer to 5%). So, I quickly concluded that, with a 19% plus Delinquency Ratio, they must have payment plans.
Upside for me, but most likely I am going to have to have a lot of auctions and really bring the occupancy down, then rent it back up.
I make a note to check the rates of the competitors and see if it looks like they are occupied or offering lots of concessions.
I realize I am going to have about 10 %to 15% ,or maybe even more of the space to lease back up after I buy, if I do.
Insurance number looks good. I can tell the management or Owner is doing as good as they can except for “payment plans.”
I never do them.
So quickly, her is the math I use:
Total deposits for six months are $157,691. Doubled they are $315,382 estimated income per year being deposited.
Stabilized, probably mostly non-climate controlled units 57,000 plus sq feet, I would estimate I could run it at, let’s say, 40% operating expenses. We would utilize a Manager and perhaps one other part-time person on-site.
So, with the existing income, I estimate NOI to be $189,229.
Depending on when and where you are looking, CAP rates very. Today I would use let’s say a 7% CAP.
So, using their current income and how I would run the project with employees, I estimate (emphases that word) real value at $2,703,274.
Next, I want to see what the potential upside is.
| Category | Description | Amount |
|---|---|---|
| GPI: | $54,055 x 12 = | 648,660 |
| Stabilized Occ: | 85% (using this because most likely lower income area) | 551,361 |
| Expenses: | 40% | 220,544 |
| NOI: | 330,817 | |
| Value: | 7% CAP | $4,725,951 |
So there is some upside.
I may not be able to buy the facility at the $2.7 number, but I kind of know what my target is.
I go about looking to determine if I can really achieve close to an 85% economic occupancy.
I can’t really remember this deal, but I must have determined I couldn’t because I never bought it.
However, I wanted to show you how much information you could really get from a single report if you really look.
I hope this was helpful.
Let me know if you use other reports to do the same thing.
The game now, at least for myself, is to buy however many projects I can and reposition them so that when people come off the sidelines to invest back in self-storage, I have something they would at least look at.
Good hunting.