Although I did not attend the most recent Self Storage Association convention in Las Vegas, I have been studying many of the sessions that occurred there.
One thing I found very interesting was the presentation that showed the results of StorageMart’s Compound Annual Growth Rate (CAGR) of Net Operating Income over the past five years using the data from 75 stores.
Without surprise, NOI growth was higher in high and medium-income trade areas than in lower-income trade areas.
Look at this chart they presented:
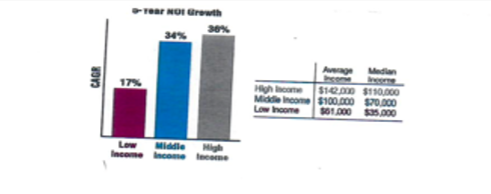
High-income trade areas increased their NOI by 36% and middle-income areas by 34%. Lower income by only 17%.
This makes sense for a couple of reasons. First of all, the average value of a customer is higher in the middle and high-income areas. This is primarily due to the average length of stay being longer.
People in lower-income areas tend to have to watch their discretionary spending, and the average length of stay is shorter.
The same income produced by a unit in a higher demographic area churns more, and rent increases are often lost because owners usually have to offer incentives to move in. This is especially true in a lease-up situation. In lower-income areas, it takes longer to achieve profitability and stabilization because the same unit is often rented multiple times.
How To Use This Information
Nothing truly surprising here, but let’s now put it into practical, usable terms that you can utilize in the field as you are looking at opportunities.
Let me share how I use this concept to contemplate a deal. I will use a project a new group I am involved with just put under contract.
It is an 11-acre site in the Carolinas that will be primarily a Boat & RV storage site. This also is the same process I use if it is just self-storage.
If you remember from the StorageMart chart, they defined high, middle, and lower incomes by number ranges. I am not exactly sure where those numbers came from. They may be national figures. I am just not sure.
What I do is pull up the demographics of the trade area and then compare it to the market area. I want to see my trade area higher than the market averages.
So, let’s look at this deal we are contemplating.
The city the site is located in has a population growth rate of 2.9%. That is good enough for me. I like seeing some growth, given population growth is the main driver for storage.
Interestingly, although not a deal killer, the population engaged in “White Collar” occupations is 69%, and “Blue-Collar” is 31%. For boats & RVs, this should be a good thing, I would think.
Let’s look at the median and average incomes for the city where the trade area is located.
But first, what is the difference between a “median” income and an “average” income?
Theoretically, if we took every household and listed their income on a spreadsheet, and there were 100,000 households, the household on line 50,000 would be the median income.
The average would be calculated by totaling all the household incomes and dividing by 100,000.
So now, let’s look at the market (i.e., city) where our site is located, then we will look at the trade area for the site. I want to see the trade area average and median household incomes higher than the average for the entire market.
City:
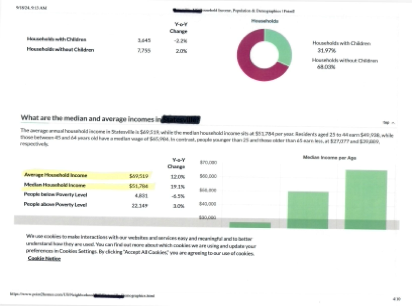
What we can see is the Median Household Income is $51,784, and the Average Household Income is $69,519.
Not bad for a southeastern state. In San Francisco, this may be close to poverty, but in the southeast, it appears to be good.
However, this is the city, or the “market.” Our site has its own trade area within this market, where the majority of customers will come from.
Let’s look at that.
In a self-storage project, usually, they will be from 3 to 5 miles from the site. In Boat and RV, the trade area is usually larger.
Ultimately, the feasibility report will define the actual trade area, but I usually pull demographics upfront and estimate the trade area.
In the case of the site we are contemplating, given it is Boat and RV, I am going to look at a 3-mile and an 8-mile radius to compare average and median incomes to the market.
I will adjust this after the feasibility report during the due diligence.
First, the 3-mile data.
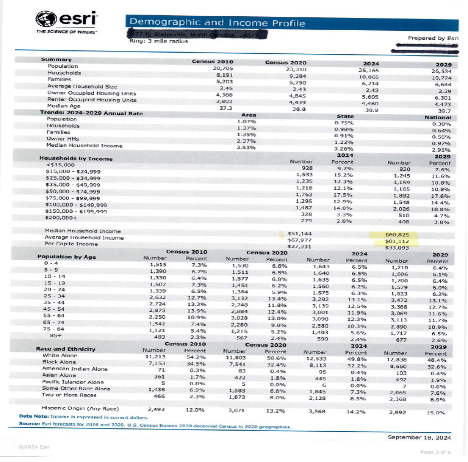
You can see in the 3-mile trade area, the Median Income is $60,825, higher than the city’s Median Income of $51,784. The Average Income is $81,112 in the 3-mile compared to the city’s $69,519.
This tells me that within three miles of our site, the average and median household income is on the higher end of the market. Great for our business, for rental rates, and the average value of a customer.
Now let’s look at the 8-mile (or is self-storage the 5-mile).
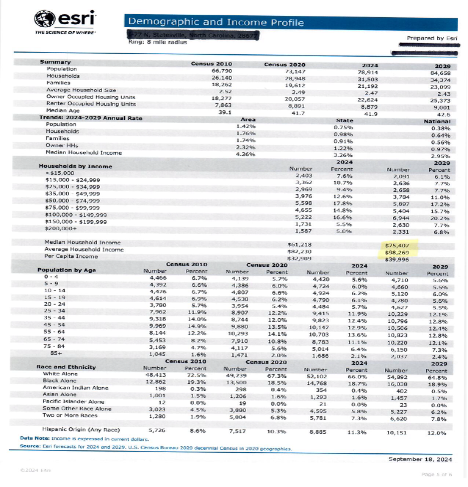
In the 8-mile trade area, the median income is $75,047, which is higher than the city’s median income of $51,784. The Average Income is $98,269 compared to the city’s $69,519.
Even stronger than the 3-mile numbers.
So, this appears to me to be the higher demographic end of that city, which is where I want to be for this type of project.
Green lights on the income front.
Obviously, there are more considerations before we remove contingencies, but I want to provide an on-the-court process one could use to support the idea of being in the middle- or higher-income areas of a market.
This is the process I use to figure out if a location is a good one for the market.
If you do something different, I would be very interested in hearing what you do. Share it so everyone can see.
I hope this helps and good hunting.