
We’ve established that we’re in an overpriced “Seller’s Market.”
But you can still get in the self storage business today. You can still grow your self storage business today.
But you have got to know what you are doing. You have got to be able to see the value added opportunities.
And most importantly, you have got to be able to figure out how much value added income and net income you can add.
Welcome to Episode Three of the “How to Analyze Self Storage in Today’s Market” series.
If you have not watched or read the first two posts in this series, do so here so you can get the context for what we are going to do now.
Today we are going to determine how much additional income a project can generate and how that income will be added to a project: expansion, conversion or new construction.
Remember, last week we learned how to determine the gross potential income (GPI) for the four types of self storage projects there are. The last three types: expansions, conversions, and new construction are the value-added types we are discussing.
As we construct the new storage space, the new income isn’t just going to show up. We have to lease up the new space we add.
It leases up slowly.
How slowly?
Well, you are not sure at this moment. You are going to have to guess.
The feasibility report will ultimately tell you what the most likely lease-up rate (or absorption) will be for the newly constructed units in the particular market you’re building in. But in the early stages, we have to guess.
I usually use 1,200 square feet per month in a market where there appears to be some demand. I have used 1,500 to 1,800 in large underserved markets, and I have gone as low as 1,000 square feet in slower, smaller markets.
Again, I suggest adjusting it after you receive the feasibility report. If I get a range in the feasibility report, I go towards the lower end of the range. It is always good to beat the number you put in your Pro Forma.
In the old days, when I was doing work for a REIT as a real estate agent finding them self storage opportunities, they would use a 5% figure. In other words, the would have their new construction lease-up at 5% per month.
I personally like using a net square foot per month number myself.
Then, the rest is easy.
You just apply the net square feet per month being absorbed on top of the average of the per square foot income you estimated. For expansions, it is the per square foot income numbers on the unit mix page.
For conversions and new construction, it is the per square foot income figure you derived from your competition (see episode 104 for full explanations).
You then have a per square foot average for climate controlled and non-climate controlled space and multiply that times the monthly per square foot number.
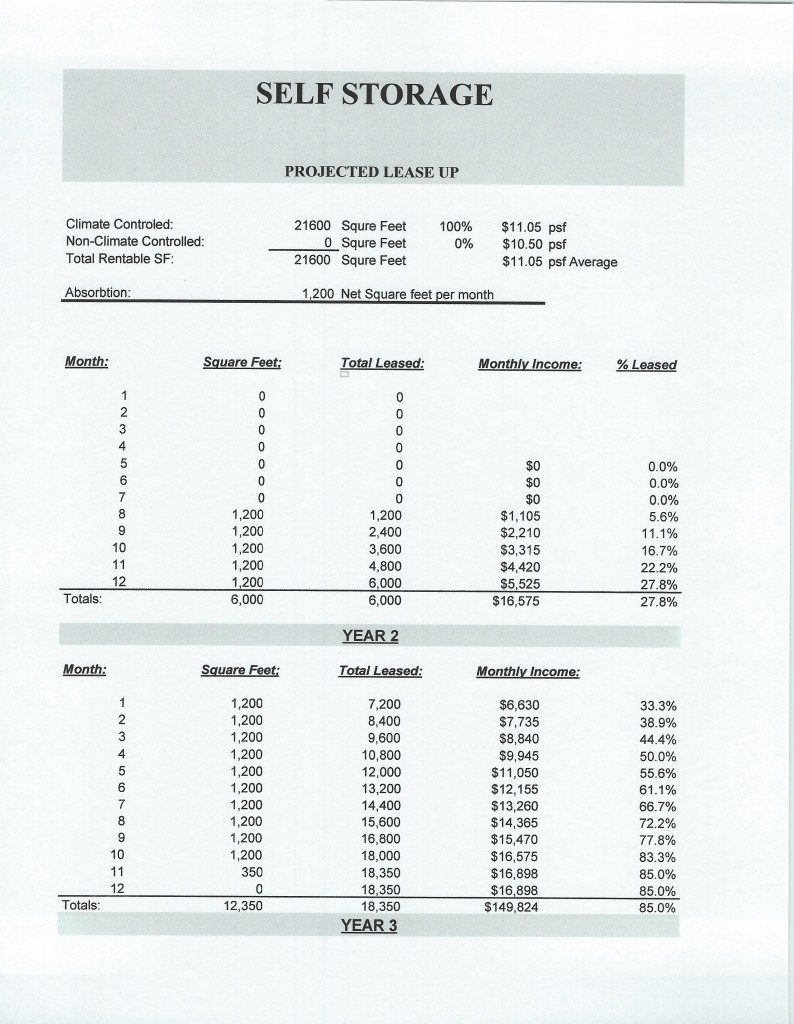
You can use financial analysis software or create an Excel spreadsheet that does the rest of the work for you. Below are some examples.
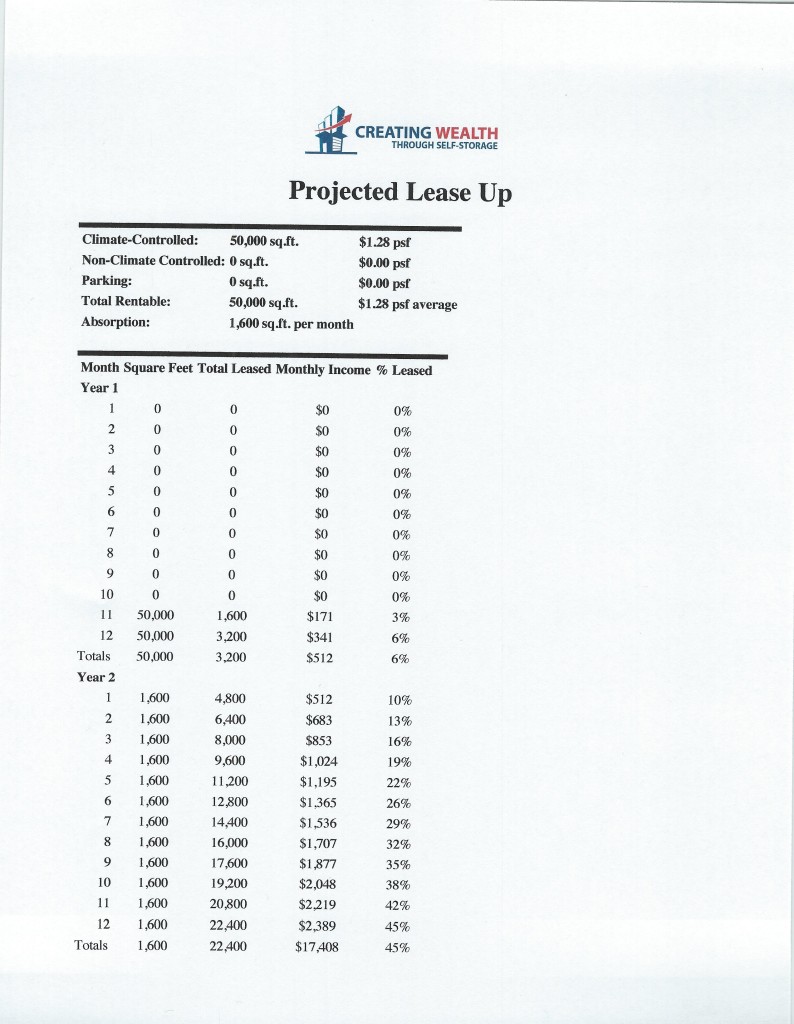
Or in Excel:
See why I like expansions today?
I not only have the existing income; which I know I am paying more than I want to for it; but I will shortly have this additional income coming in (assuming the feasibility report indicates there is demand enough in the submarket to absorb my new square feet of self storage).
The new income will stop when you hit the “stabilized occupancy” number you’ve determined for the facility you’re analyzing. Remember, even if it appears to be over 90% now, I still recommend using 85% to 88% in these programs.
Believe me, if I am wrong, and it stays above 90%, you look great. If it goes back down towards historical norms, you will look good then as well.
Try to make sure the deal works with these lower stabilized occupancy numbers. Your future self, your banker, and your partners will appreciate it.
That is all there is to it.
Now think about it. You know how to generate GPI for all types of self storage projects (episode 104). You now know how to figure out how much and how fast new income can be added to the project.
That is a lot. Remember, there is more training, both free and paid, at QuickStartAcademy.com that goes much deeper into this. However, don’t underestimate yourself. You now know more than 85% (I am totally guessing here) of the world in how to analyze self storage.
This is the type of thinking, analysis, and work that is necessary in today’s market.
Once you do a project or two, and you exceed your Pro Forma absorption number a couple of times, you will begin to develop real confidence in your numbers. Until then trust yourself.
Will it be exactly 1,200 square feet absorption per month?
No.
But you should not be off by much. I have averaged from 1,435 square feet per month all the way to 3,400 square feet per month in a large, tier-one city (on an expansion).
Your absorption numbers may be higher or lower, but you have got to start with an educated guess. And now you know how to do it.
The last piece in the income area is any additional income such as retail sales, truck rental, tenant insurance, etc.
Don’t underestimate how important this is and how much added value it can be.
We average $100 to $450 per month on 50,000 square foot facilities and over $1,000 per month on some of our larger ones.
Use your business strategy to answer the question of what additional income sources you may have.
If you are anticipating truck rental income, until you get a feel or the numbers, you can call a truck rental company and ask them what they think you can do in income at the location. They always have told us their thoughts. Then, lower it slightly and use that number.
Then total up the stabilized occupancy for existing space (if any), and the income coming in from the newly constructed space along with the additional income sources, and you have the total income picture.
Remember to use an average rental increase figure per year to have that income growth over the analysis period (in the Storage World Analyzer we use a ten-year period).
We use 3% income growth per year, although, we have been averaging way more than that in the last 8 years. But again this Pro Forma is for the future, not the past. If you have been averaging 6%, using a 3% or 4% for future years will make you look like you know what you are doing.
And you do…now. On the income analysis side at least.
Next week let’s talk about construction, construction budgets, and debt service.


easy concepts to get and implement, thank you